Reporting Dashboard
Overview
Reporting Dashboard based on Kibana provides an overview of the most important reports for the usage of the Axinom DRM License Service.
This features is only available for customers with standard or premium support level. For more information, check support levels and support pricing. Customers with basic support can still see the key reports in Axinom Portal under My Mosaic.
Dashboard
In the upper right you can select the desired timeframe, e.g., "Last 7 days" or "Last month".
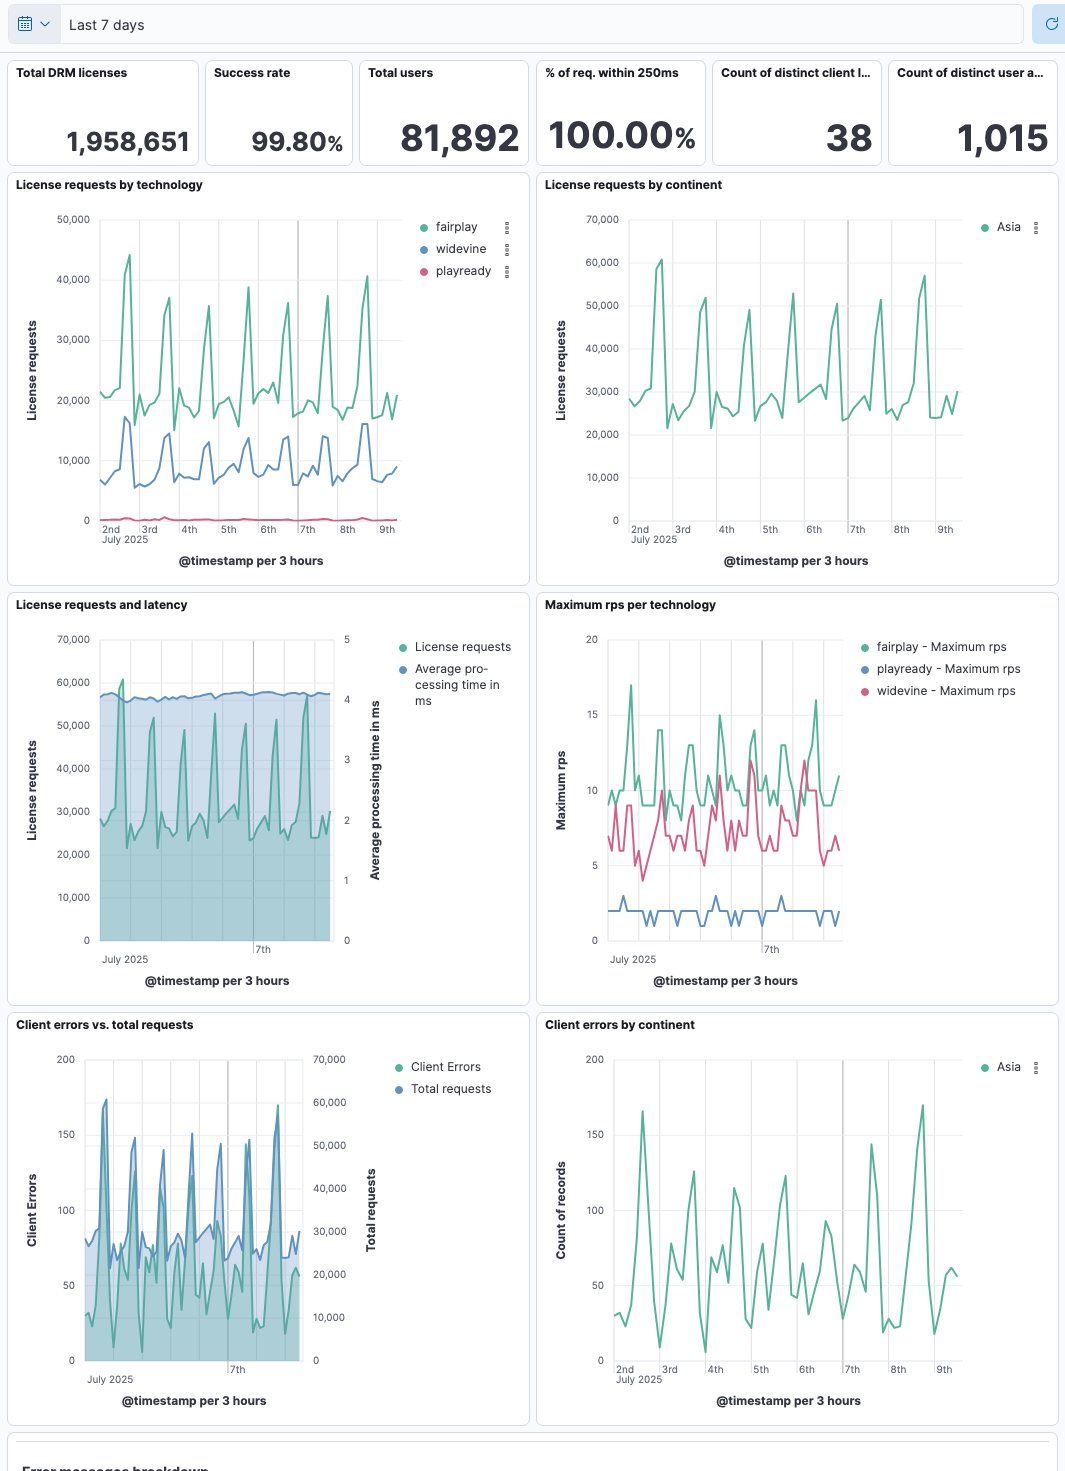
The report headline provides an overview of the most important numbers (totals):

The dashboard provides widgets displaying the most important reports:
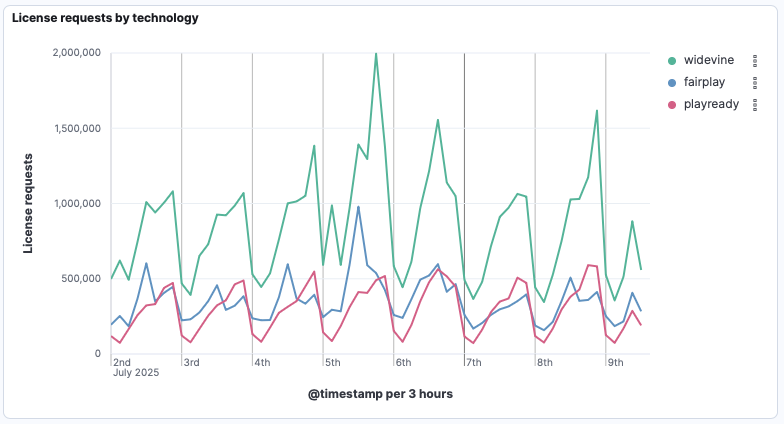
License Requests by DRM Technology
License requests per technology shows a quick overview how licenses requests are distributed between Widevine, FairPlay, and PlayReady:
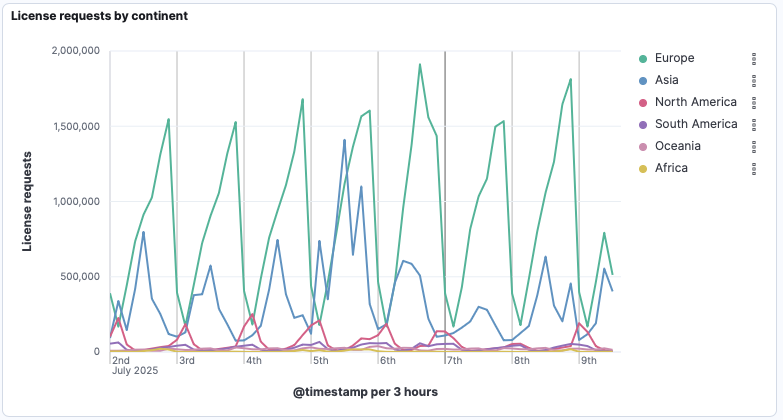
License Requests by Continents
Distribution by continent:
License Requests and Latency
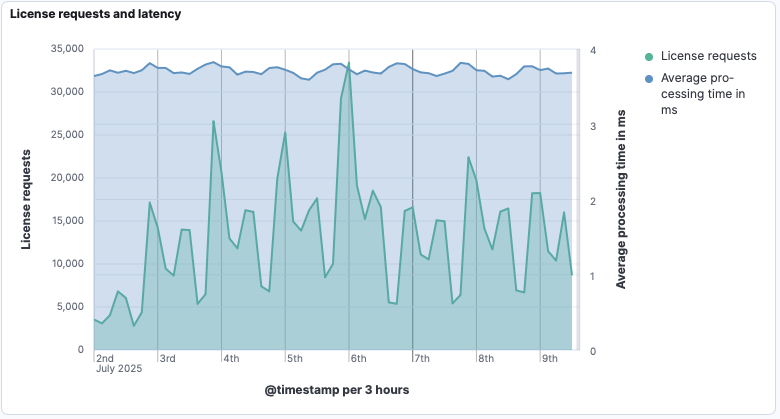
The graph “License requests and latency” shows two graphs at once - total license requests (the Y-axis is displayed on the left) and the average request processing time in milliseconds (Y-axis on the right). This is useful to understand if and how increased consumption influences average processing times.
Maximum RPS per technology
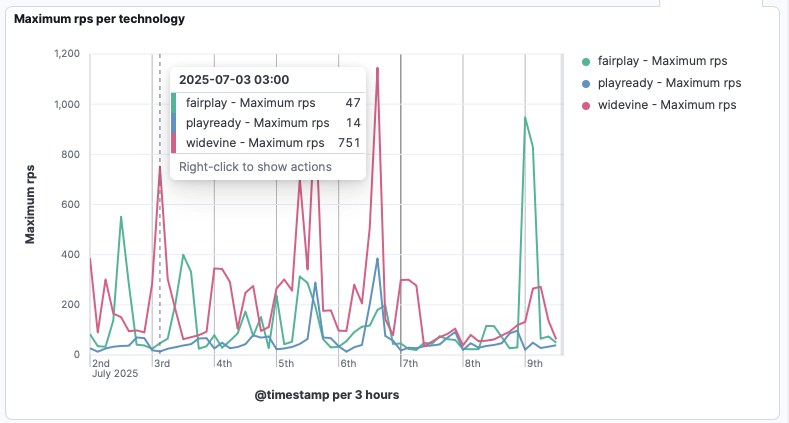
“Maximum rps per technology” shows the maximum number of requests that arrived at the service in a single second. The example graph below shows one value for every three hours. The graph shows “751” for Widevine for the 3rd of July at 3 o’clock. This means that 751 Widevine requests arrived at the busiest second in the three hours between 03:00 and 06:00.
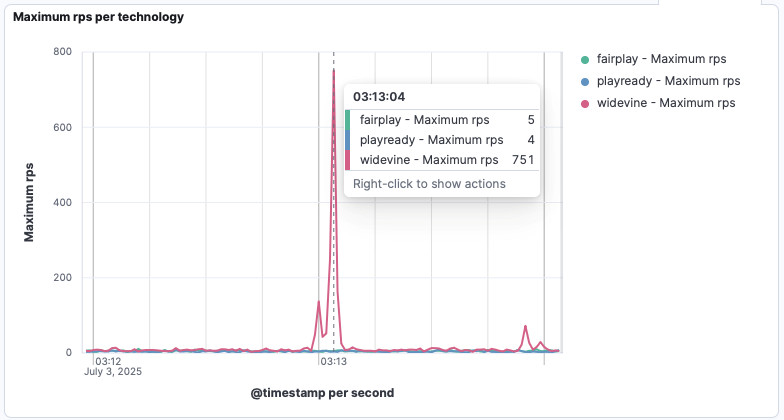
Zooming in reveals that the one second that saw the 751 Widevine requests occurred at 03:13:04. Below graph shows that time and has a time-wise resolution of “one second”.
Client Errors vs. Total Requests
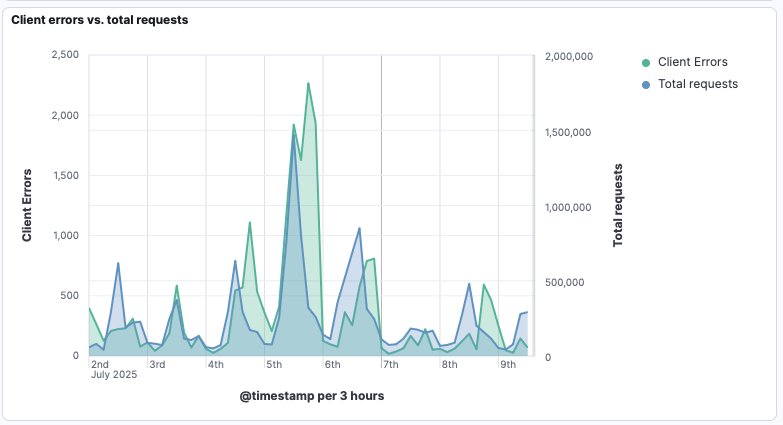
“Client errors vs. total requests” is another graph with two Y-axis. The scale on the left refers to client errors, while the scale on the right covers total license requests. This graph helps customers easily spot anomalies in client behavior over time and understand if the ratio between requests and client errors is at a reasonable level.
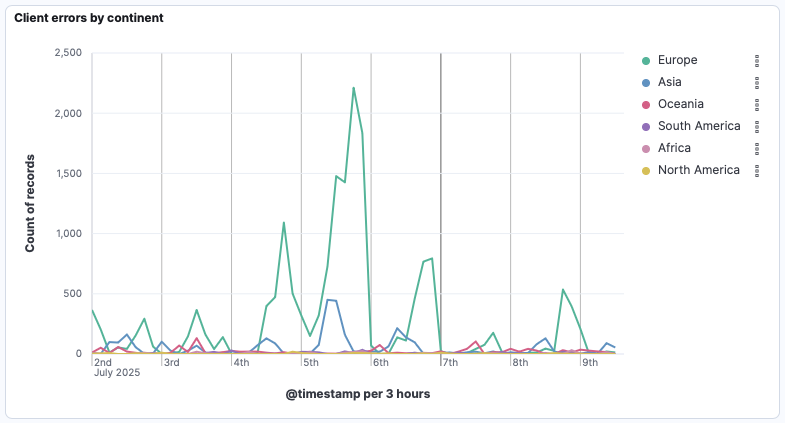
Client Errors by Continent
Another graph showing client errors. This time broken down by continent: