Error Logs
Error Logs specify the reasons for failed license requests. Error Logs are accessible in Portal under the My Mosaic section.
Note that you need to have an access to at least one DRM tenant (Evaluation or Production) to see the logs.
Accessing the Error Logs
You can access the Error Logs section from the My Mosaic area.
To access the logs from My Mosaic:
-
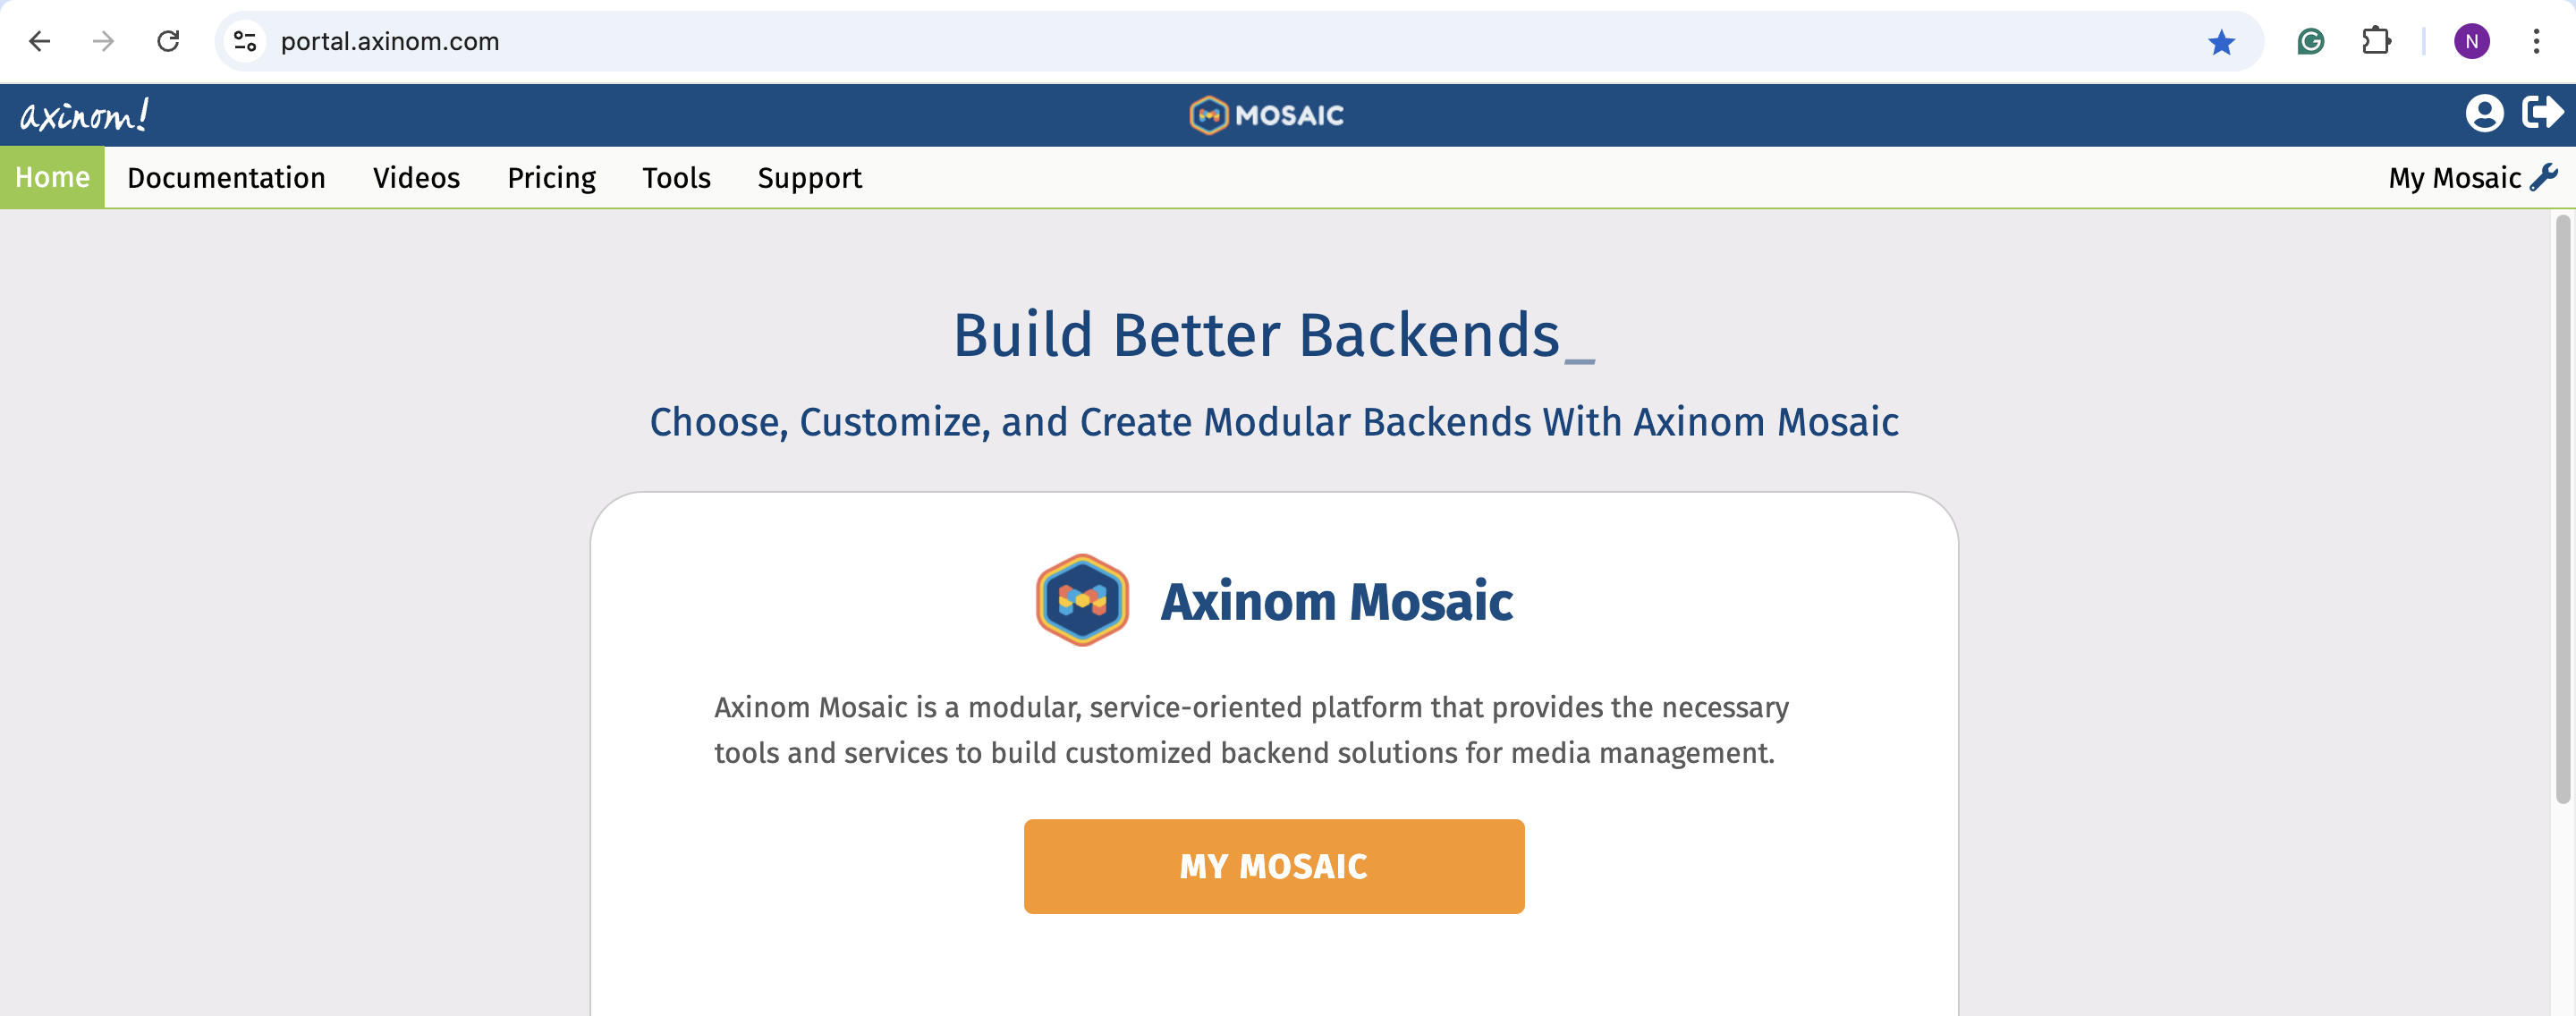
When logged in to your Portal account, click the My Mosaic button on the right, under the account management and log out buttons.
Click My Mosaic on the right
-
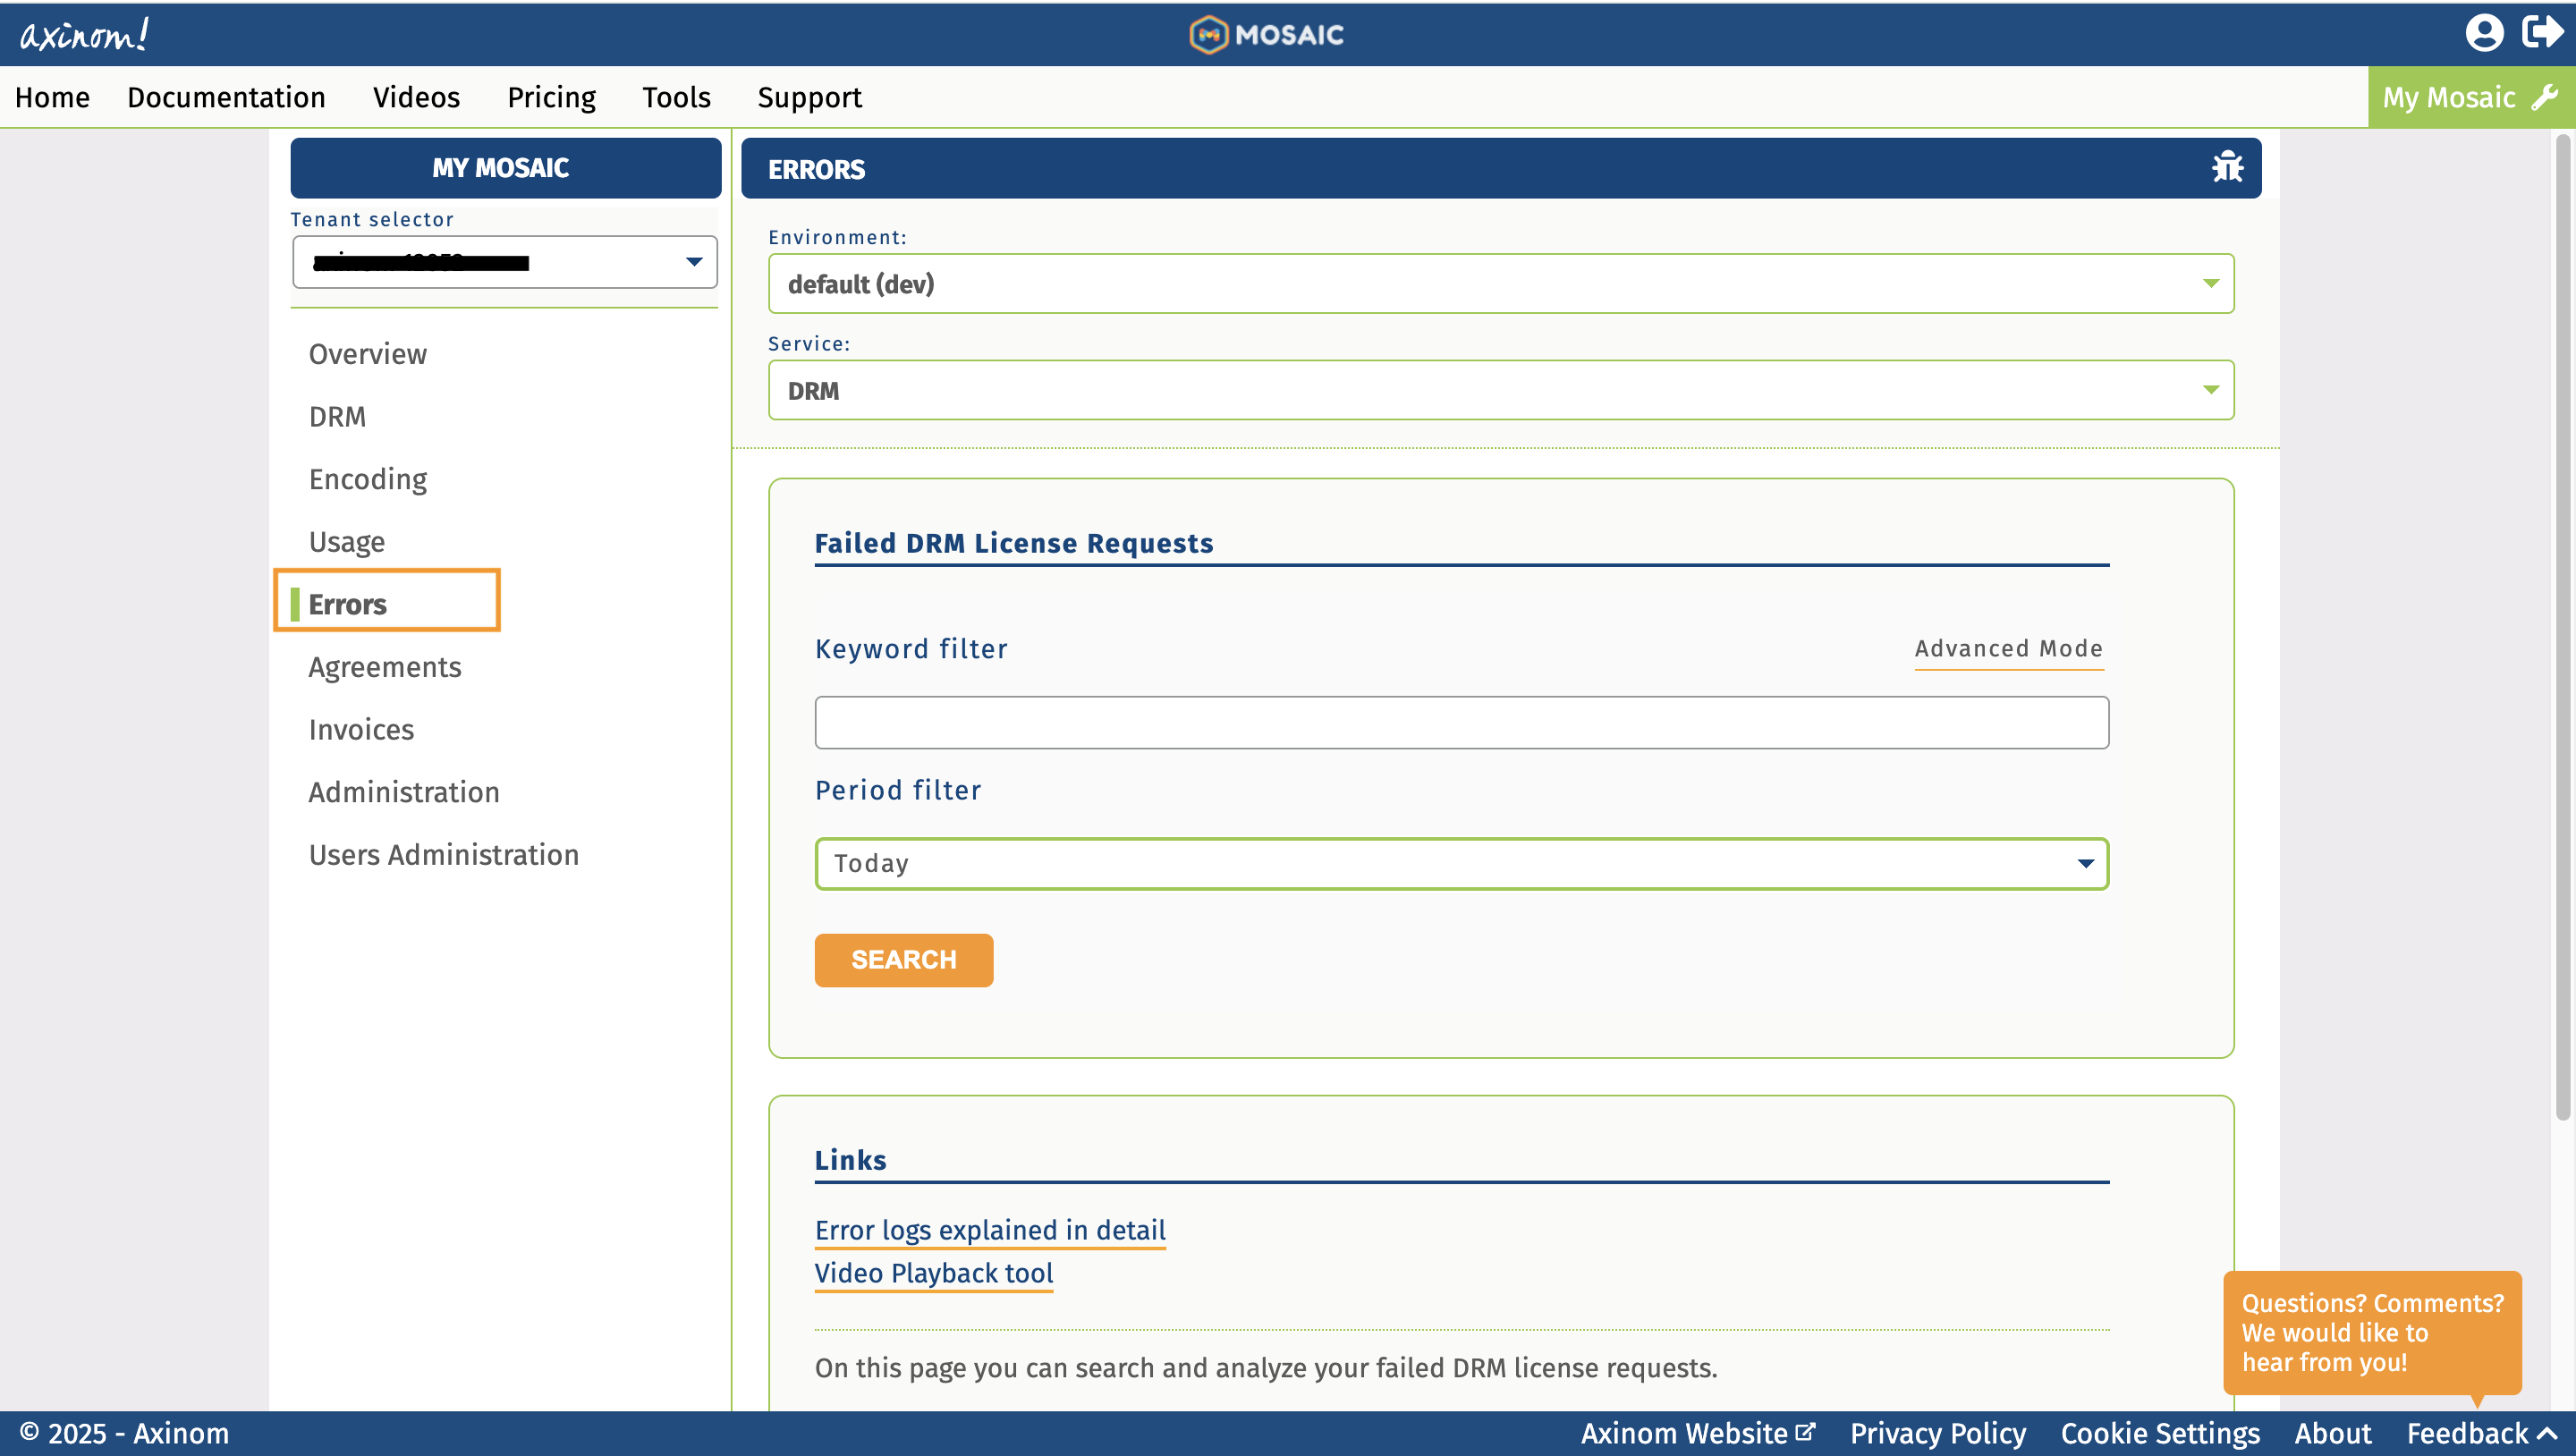
Once in the My Mosaic area, click Errors from the vertical menu on the left.
Click Errors
Filtering the Error Logs
Once in the error logs view, you can search for the logs by specifying the keyword and the filtered period. The period filter is self-explanatory and refers to the period of error logging. You can set the period to:
- Today
- Yesterday
- This week
- Last week
- This month
- Last month
- Custom (both date and time can be specified)
Keyword Filter Modes
The Simple Mode for the keyword filter expects you to insert one or multiple keywords to the textbox. The Advanced Mode allows you to use multiple keyword filters as well as the logical AND and OR operators.
The filters available in the Advanced Mode include:
- User Agent
- Reason
- DRM Type
- Request URL
- Origin Host
- Referrer URL
- IP
- Country Code
To filter with multiple keyword filters in the Advanced Mode:
-
Switch to the Advanced Mode.
-
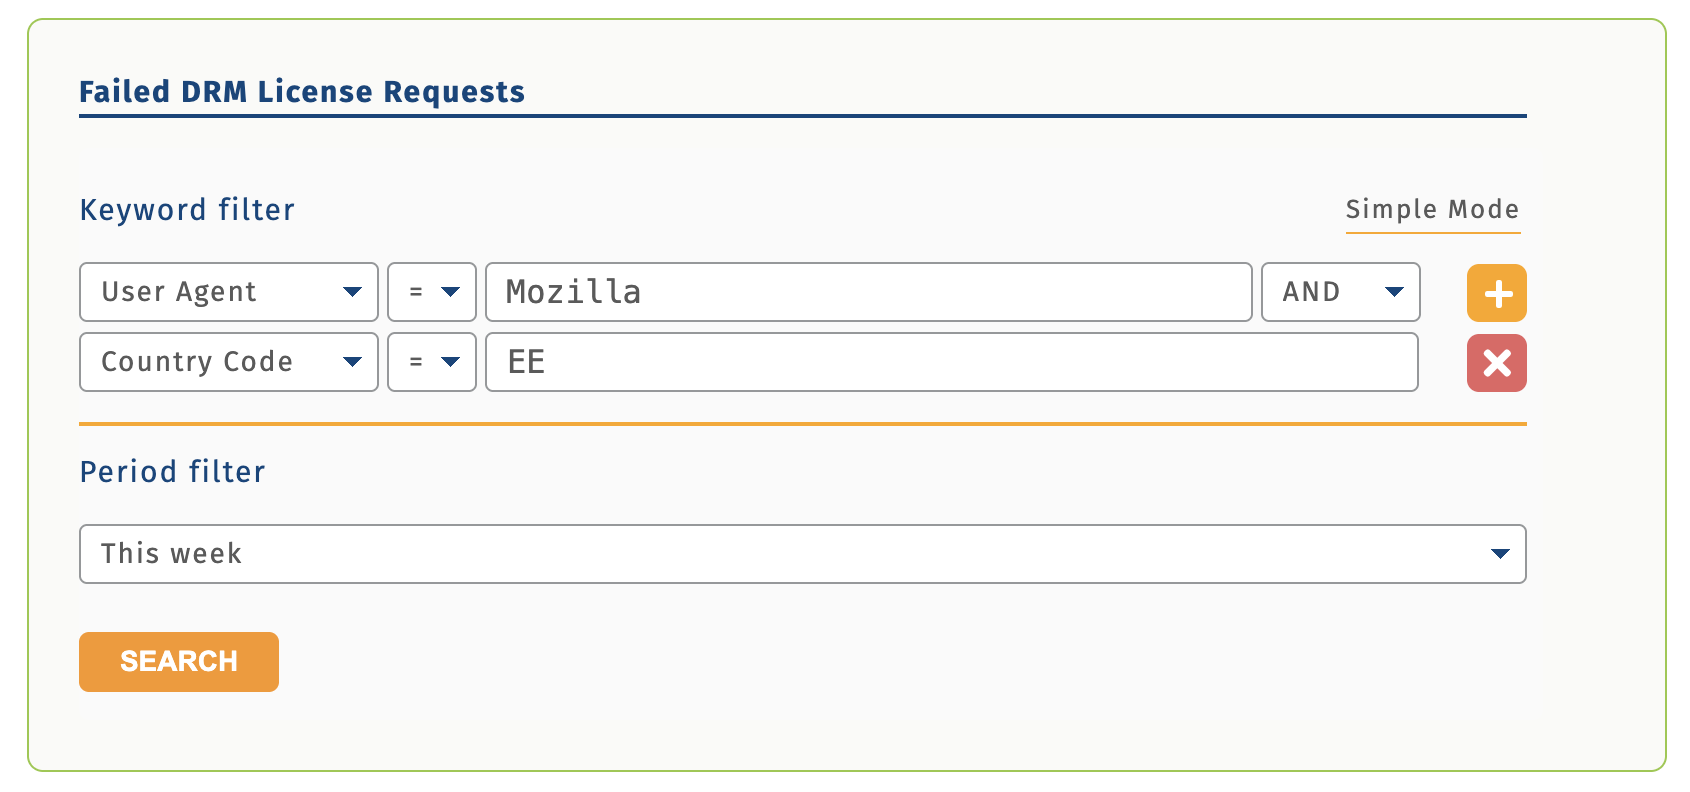
Select a filter from the drop-down menu. Set it either to "equal" (
=) or "not equal" (≠) from the other drop-down. The default value is "equal". Write the keyword filter value into the textbox. Note that the filters are case sensitive. -
Click the
+sign to add another filter.Filtered by "Country Code" equals "EE" AND "User Agent" equals "Mozilla"
 note
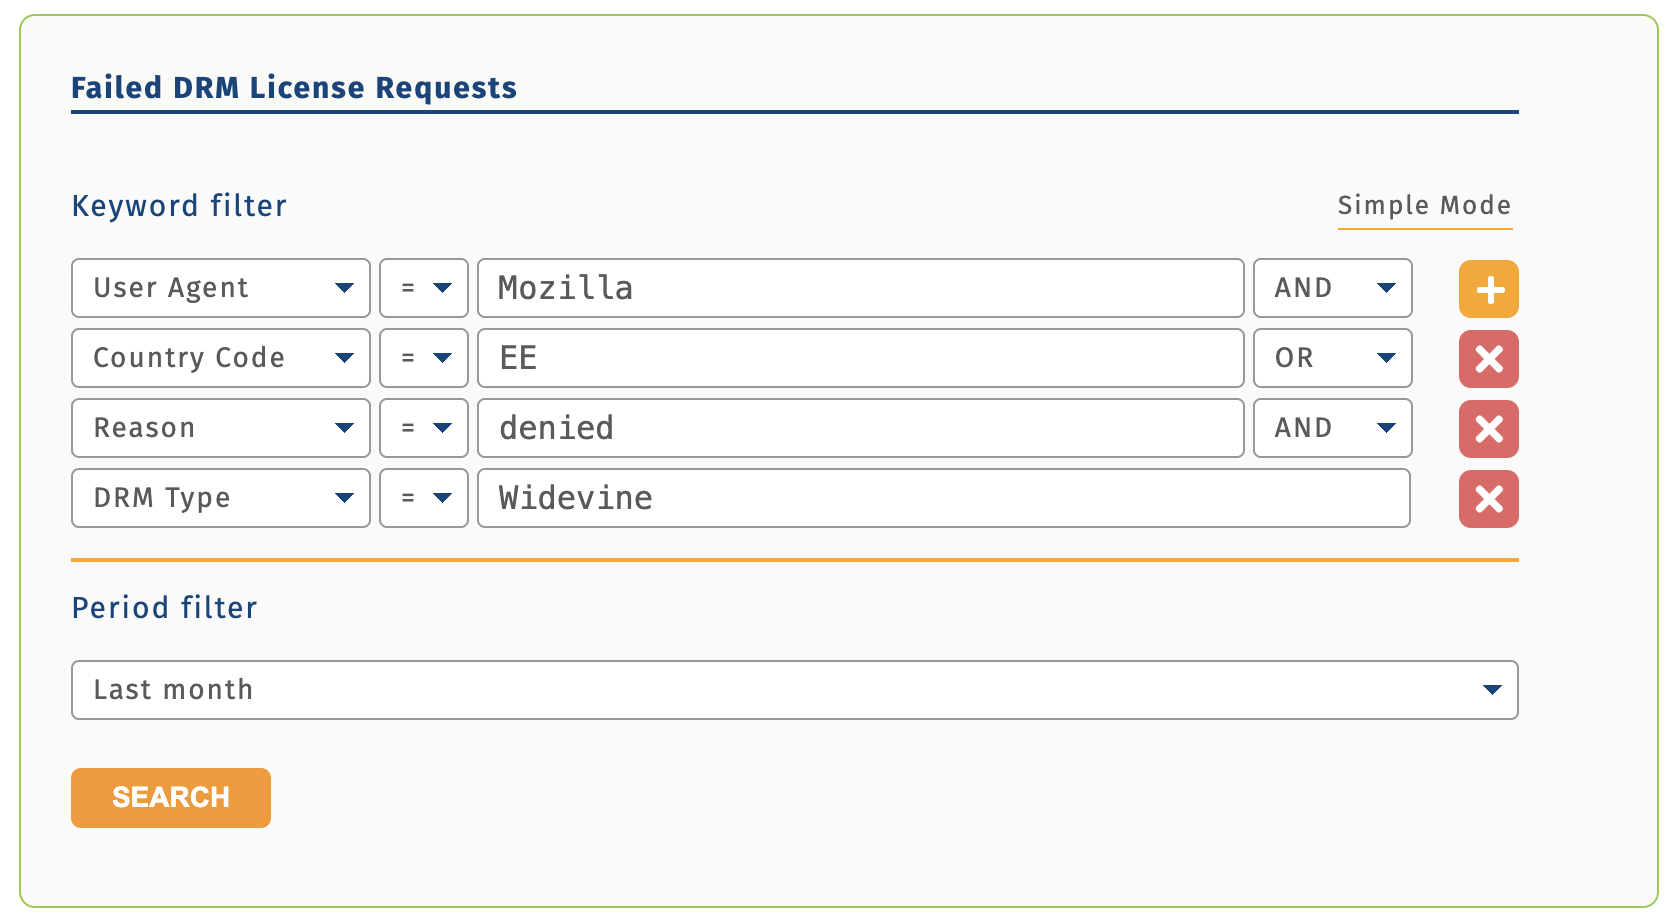
noteIf you use both AND and OR operators at the same time, the OR operator takes priority over the AND operator. This means that the OR operator is first applied to the OR filters. Afterwards, the AND operator is applied to the OR-group result, e.g "(A) AND (B OR C) AND (D)". See an example below.
"User Agent" equals "Mozilla" AND "Country Code" equals "EE" OR "Reason" equals "denied" AND "DRM Type" equals "Widevine"
-
Once you have specified all the needed filters, click Search to view a list of error logs.
-
If no error logs are found with the filters, the message "No error logs found matching your query." is displayed.
Error message when no logs are found

Viewing the Logs
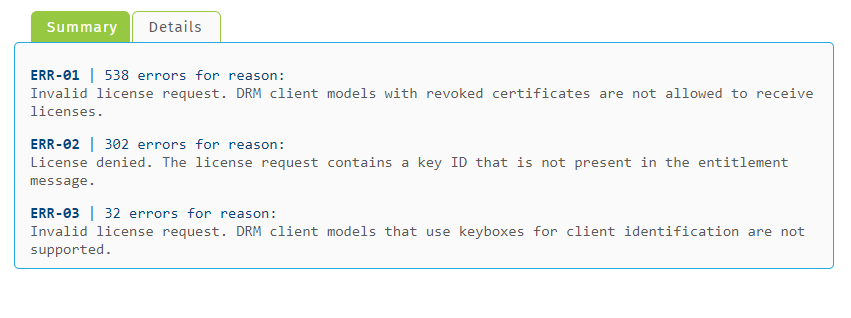
When you have applied the filters, you are shown summary and details of error logs on two different tabs. In the summary part, you can see the error name (e.g. "ERR-01") and the number of errors that were found for that reason. The error is specified as text as well, e.g. "Invalid license request. DRM client models with revoked certificates are not allowed to receive licenses." See an example below.
Summary of errors
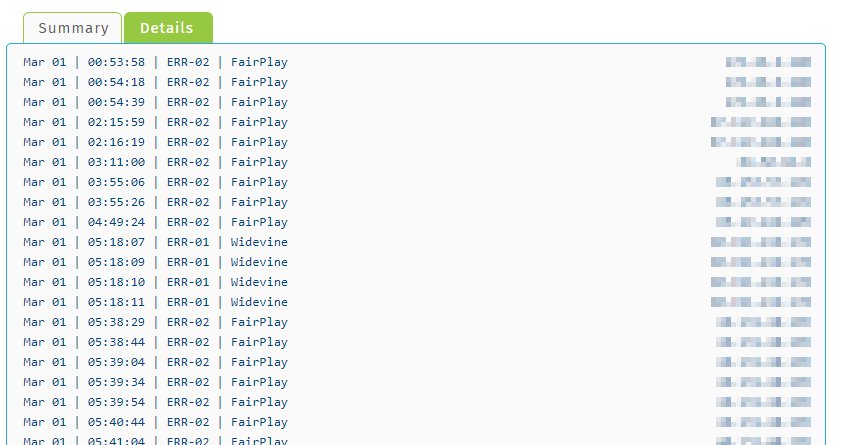
If you click the Details tab, a full list of errors is displayed for the filtered period. They are listed in the order of appearance, i.e. the most recent errors are on the bottom.
In the Details list, you can see the following details:
- Date (e.g. Mar 01)
- Time (UTC format)
- Error code (e.g. ERR-01)
- DRM technology (e.g. FairPlay)
- IP address
Error details list, IP addresses have been blurred for the purposes of confidentiality (visible to you in the logs view)
If you click any row in the details list, you can view the specific occurrence of an error.
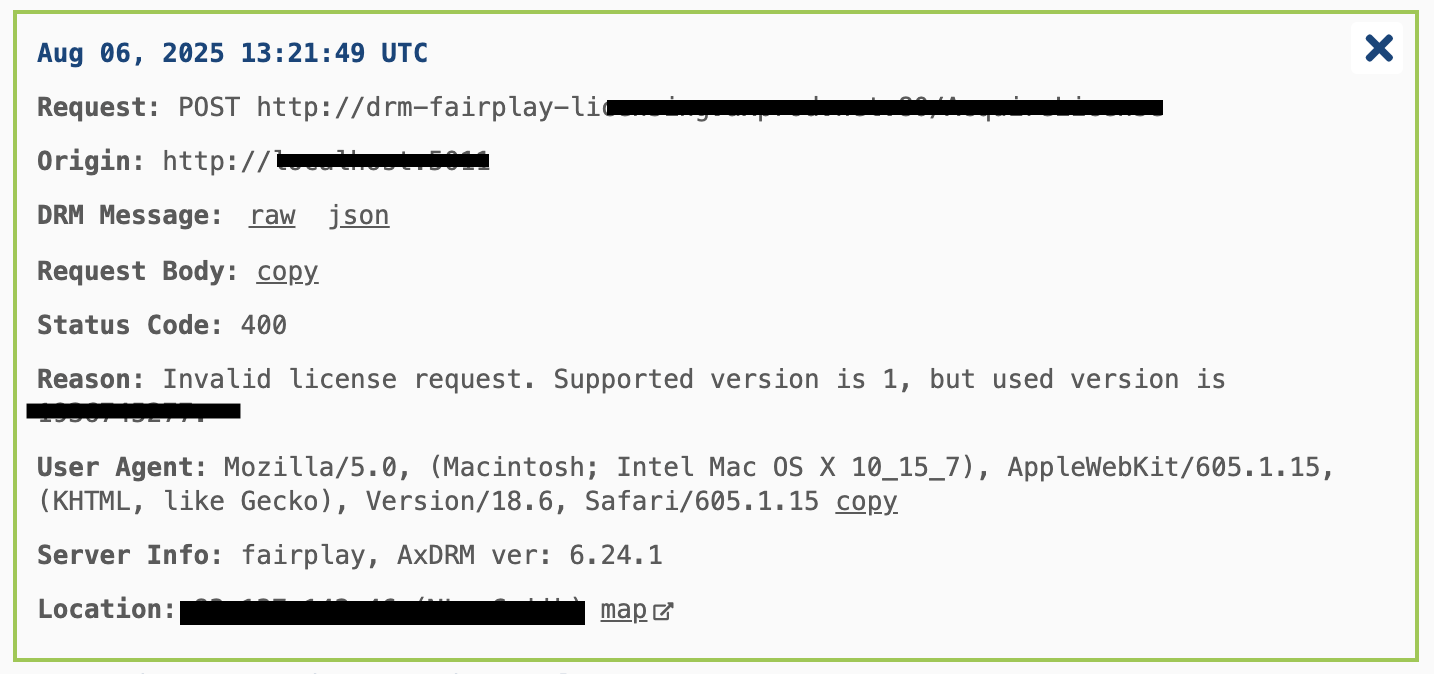
The error logs details include:
- Date and time of the error in UTC
- Request type and URL
- Origin
- DRM message, available in raw and JSON format (clickable links, the message opens below them)
- Request Body with copy link, allowing to quickly paste this data
- Status Code
- Error reason as text
- List of User Agents (e.g. Mozilla, Safari, etc. and versions)
- Server Info (type of DRM technology, server version)
- Location: IP address, country code, and link to location on Google Maps
Details of a specific error log, sensitive information blurred for this article
